Creation
- CCircle, holdAltfor point to point
- RRectangle
- LLine, hold
Shiftfor axis alignment - PPolygon, selected Polygon will be extended, hold
Shiftfor axis alignment, Polygons in loops are always extended
Backspaceto delete points (for current step) - WText There's only one font atm.
- H Toggles an objects Helper status
- DelDelete selected object. If other objects use this object, they will be deleted too.
- Ctrl+Z Undo
Transformation
- GMove, hold
Shiftfor axis alignment - SScale, hold
Shiftto scale uniformly - TRotate
Glomping
- Tab will switch to glomping when some tools are active
- Repeatedly Tab to cycle through objects that support it. Cycle ends with glomping mode off.
Steps
- Select a steps byclicking it.
Shift to select a region. The drawing will only be drawn up to the last step in the selection - ↓ to advance the drawing one step. Loops will be iterated accordingly. You cannot go backwards.
- Delete a step by clicking the
 -button
Steps depending on the deleted step will be removed as well. - With an object selected click the
 -button to only show the steps that use the selected object.
Editing Steps
- Select a step to edit it.
- Input values to change the drawing. Input Datafield names to make a step depend on data
- Drag and Drop Data fields or properties on input fields
- Change the name field in create steps ro rename an object
Expressions
- Use expressions wherever you can enter a value
- (, ), +, -, *, / are supported
- Functions on lists
- max(<list>) - maximum value
- min(<list>) - minimum value
- size(<list>) - number of entries
- avg(<list>) - average
- median(<list>) - median
Loops
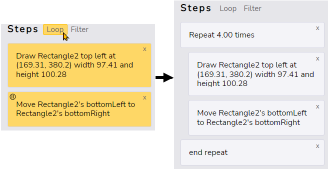
- Select Steps and click Loop to wrap them in a Loop

For Each
- Use a value list as the iteration data of a Loop. It will be automatically turned into For each.

works for typing the field name and drag and drop. - Current value is accessed using $<list>
drag and drop will do this automatically
Library
- Login to use the library
- Save the drawing by clicking the
 -button
 - Insert a drawing from the library by clicking the drawings image. Then drag a rectangle.
- Edit a drawing from the library by clicking the
 -button
Publish
- Publish the drawing by clicking the
 -button You'll get a zip-file containing everything to use the drawing on your own web page.
Styles
- Select the object by clicking on it
- Fill color is set by the color picker.
- Fill opacity is set by the slider to values between 0-1
- Stroke color sets the outlines color
- Stroke width sets the thickness of the oulinte to values between 0 and 100
- Styling steps are created. Subsequent steps of the same type are merged.
Data
- Add a new data field by clicking the
 -button below the list
 - Change the value by either entering it or holding Ctrl while clicking into the field and dragging the mouse left and right
- Double click the name to rename the field.
- Click the
 -button at the end of a field to add a value. Single value fields will be turned into lists.
 - Empty a value to remove a value from a list. Will not work for single value fields.
- Turn a field into a table by clicking the
 -button.
 - Remove a data field by clicking the
 -button
 - CSV-files can be uploaded by dragging and dropping onto a data field. Header with column names and comma as separator are expected
Object Properties
- Properties can be used as data.
Select an object and they are listed on the right.
drag and drop on the step field or
type <object name>@<property name> e.g. Circle1@radius
 -button
 -button to only show the steps that use the selected object.

 -button
 -button
 -button You'll get a zip-file containing everything to use the drawing on your own web page.
 -button below the list
  -button at the end of a field to add a value. Single value fields will be turned into lists.
 -button.
 -button